Inflation in a US millennials lifetime (an independant review)
Inflation is defined as the decline in purchasing power of a given currency in time. Typically this is measured by measuring changes in a spread of the price of a basket of goods and services – things like oil, corn, etc. But this is an independent review, so let’s see if we can look at this another way.
For me, very simply, the measurement of inflation is how far will my dollar go when it comes to buying me things I want. And there are a few ‘things’ I would want my dollar to buy me:
- The dollar buys me things I need – These are the traditional household goods and individual services typically associated with the ‘regular’ definition of the term. My car and a back massage among everything i consume to live.
- The dollar buys me a home to stay
- The dollar buys me more dollars – I do have an MBA after all, and investment and productive assets are important to me as they help me gain wealth and improve the quality of my life over time.
- The dollar buys me ‘security’ – what i mean here is that it allows me to buy assets or freedom to get through a rainy day. Security here could mean a savings account in case I get in an accident, or it could be a global use of the world, and includes security from a massive EMP wiping out the internet, or a monetary reset, or any of the other things that haunt me from The Purge movies I love.
Since these are the things I’d like my dollars to do for me (and for the purpose of this article lets say each is of 25% importance to me) – If the price of my groceries are going up, but the cost of my home is going down – I’m overall OK. But to understand the net change of monetary and fiscal policy during my lifetime, I’d like to look at all of these first independently and then cumulatively to see what type of historic advantage or disadvantage I have. So let’s begin.
Things I Need Burgers, Cars and Back Massages
The Result:
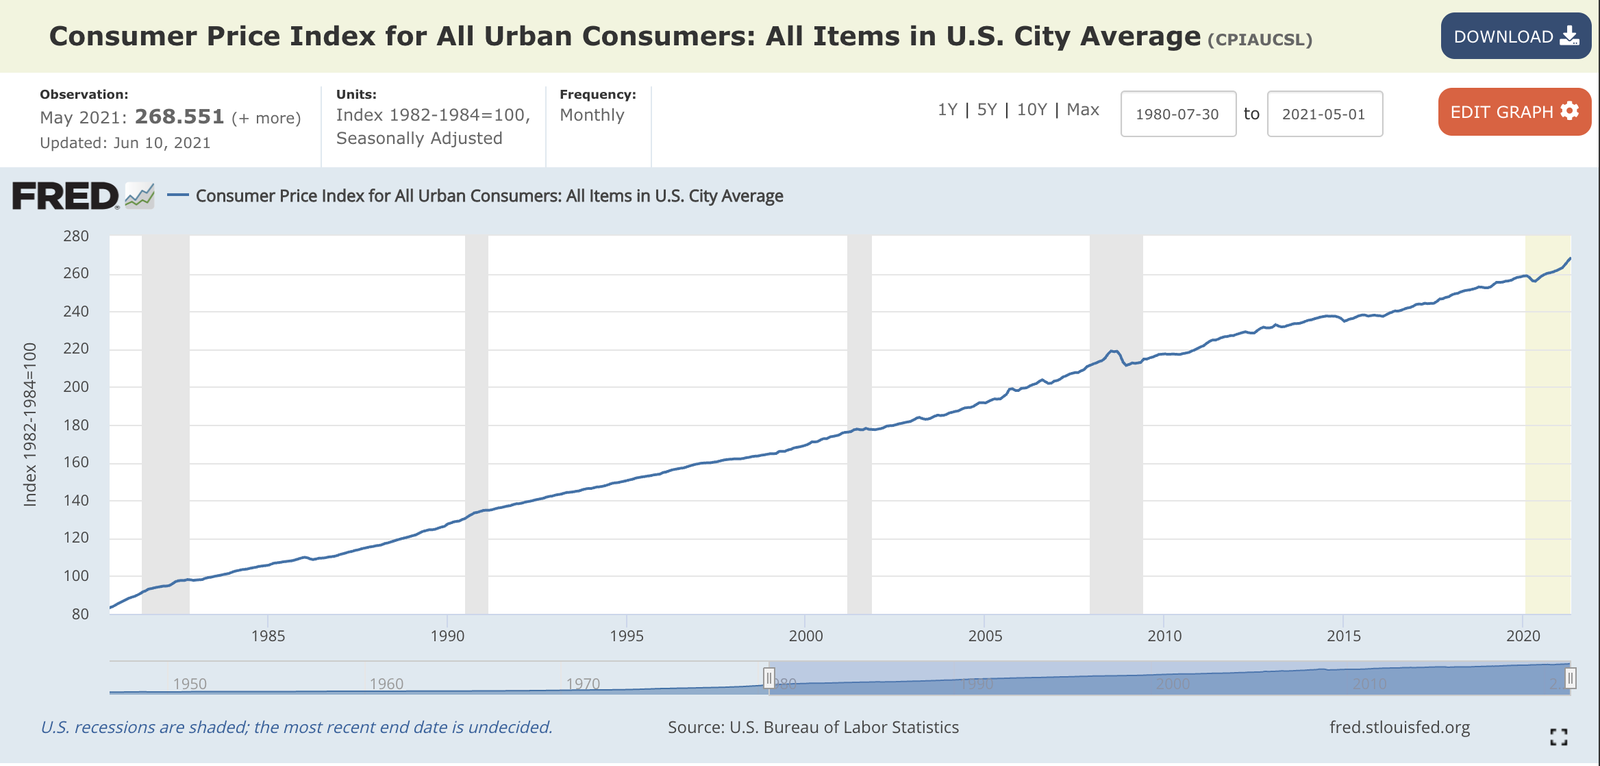
The US Urban CPI has multiplied 3.2 times since 1980, at an average of 2.9% per year.
In the last 12 months, it increased about 5% (although admittedly a majority of this increase is related to the price of gas, which is manipulated by an oligarchical market, and used car prices influenced by a supply constraint for semiconductors)
A Place To Stay My Home-Office, Home-Gym, and Kitchen
The Result:
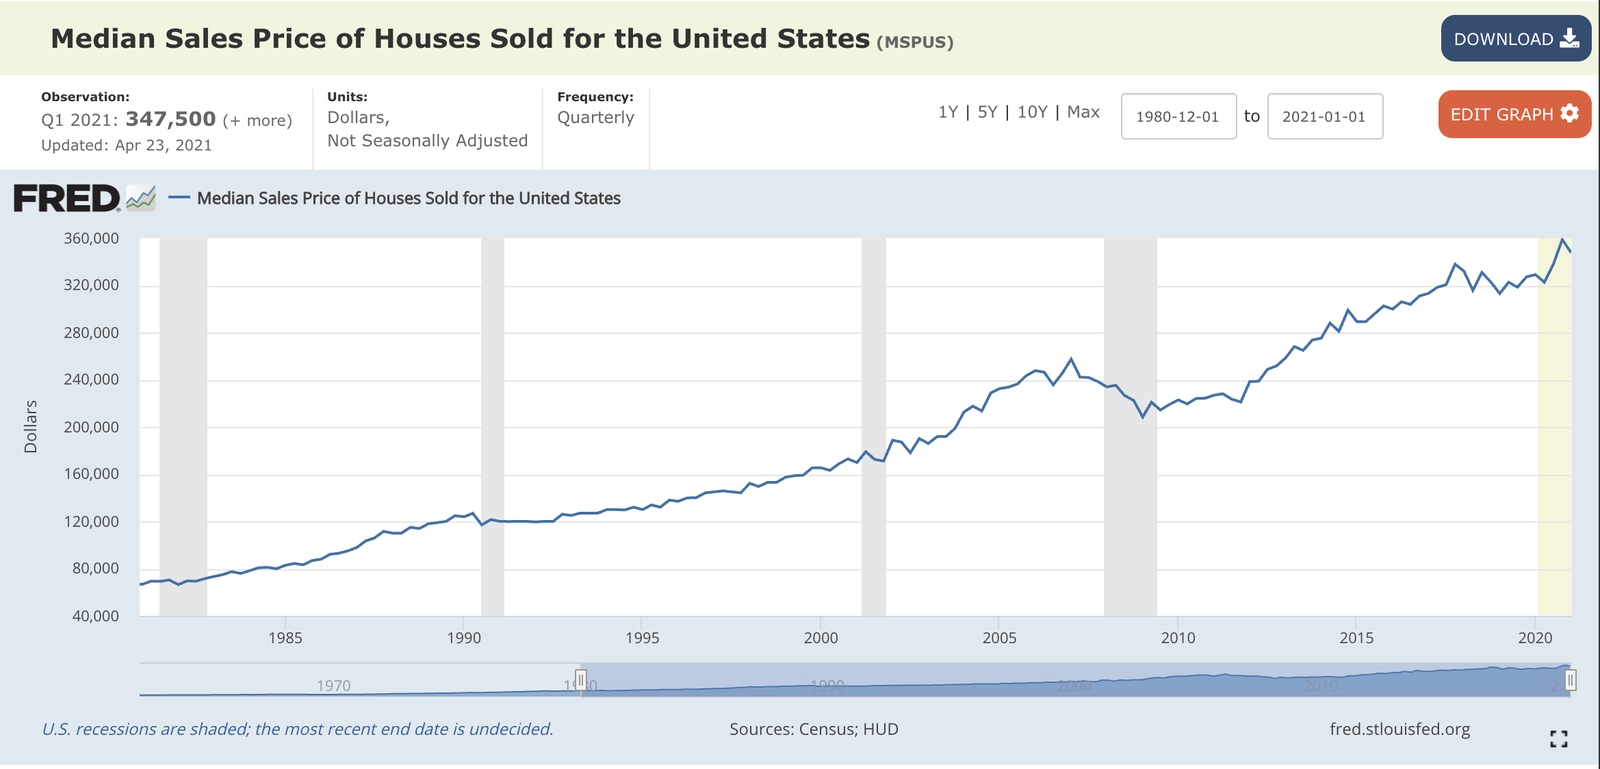
Median sale prices of houses have increased 4.2 times since 1980, at an average of 4.1% per year. .
We also saw an 8% increase in the last 12 months, (notably peaking at about 11.5% before coming back down). This is also heavily influenced by lack of inventory related to:
- New building construction reduced due to lockdown, staffing and high lumber costs.
- Evictions, foreclosures etc being restricted by law
- Frank and Mary not wanting to sell their home during a global pandemic.
More Dollars My Stocks and Bonds Portfolio
Things are about to get more complicated, so lets keep things as simple as we can and assume we are an average “defensive intelligent investor” with a 50-50 split between SP500 stocks and US bonds.

The price of S&P500 index has increased 32 times since 1980 at an average of 8.9% per year.
A large part of this would be corporate decisions to re-invest dividends which would add the dividend yield into the price of the stocks – so after subtracting (lets approximate 4% as the difference in yields), we see an approximately 5% price growth per year.
Partially affected by the sell off in March ’21, the SP500 has risen 40% in the last 12 months (although in July ’21 the market had almost completely recovered and was only 8% lower than previous all time highs)
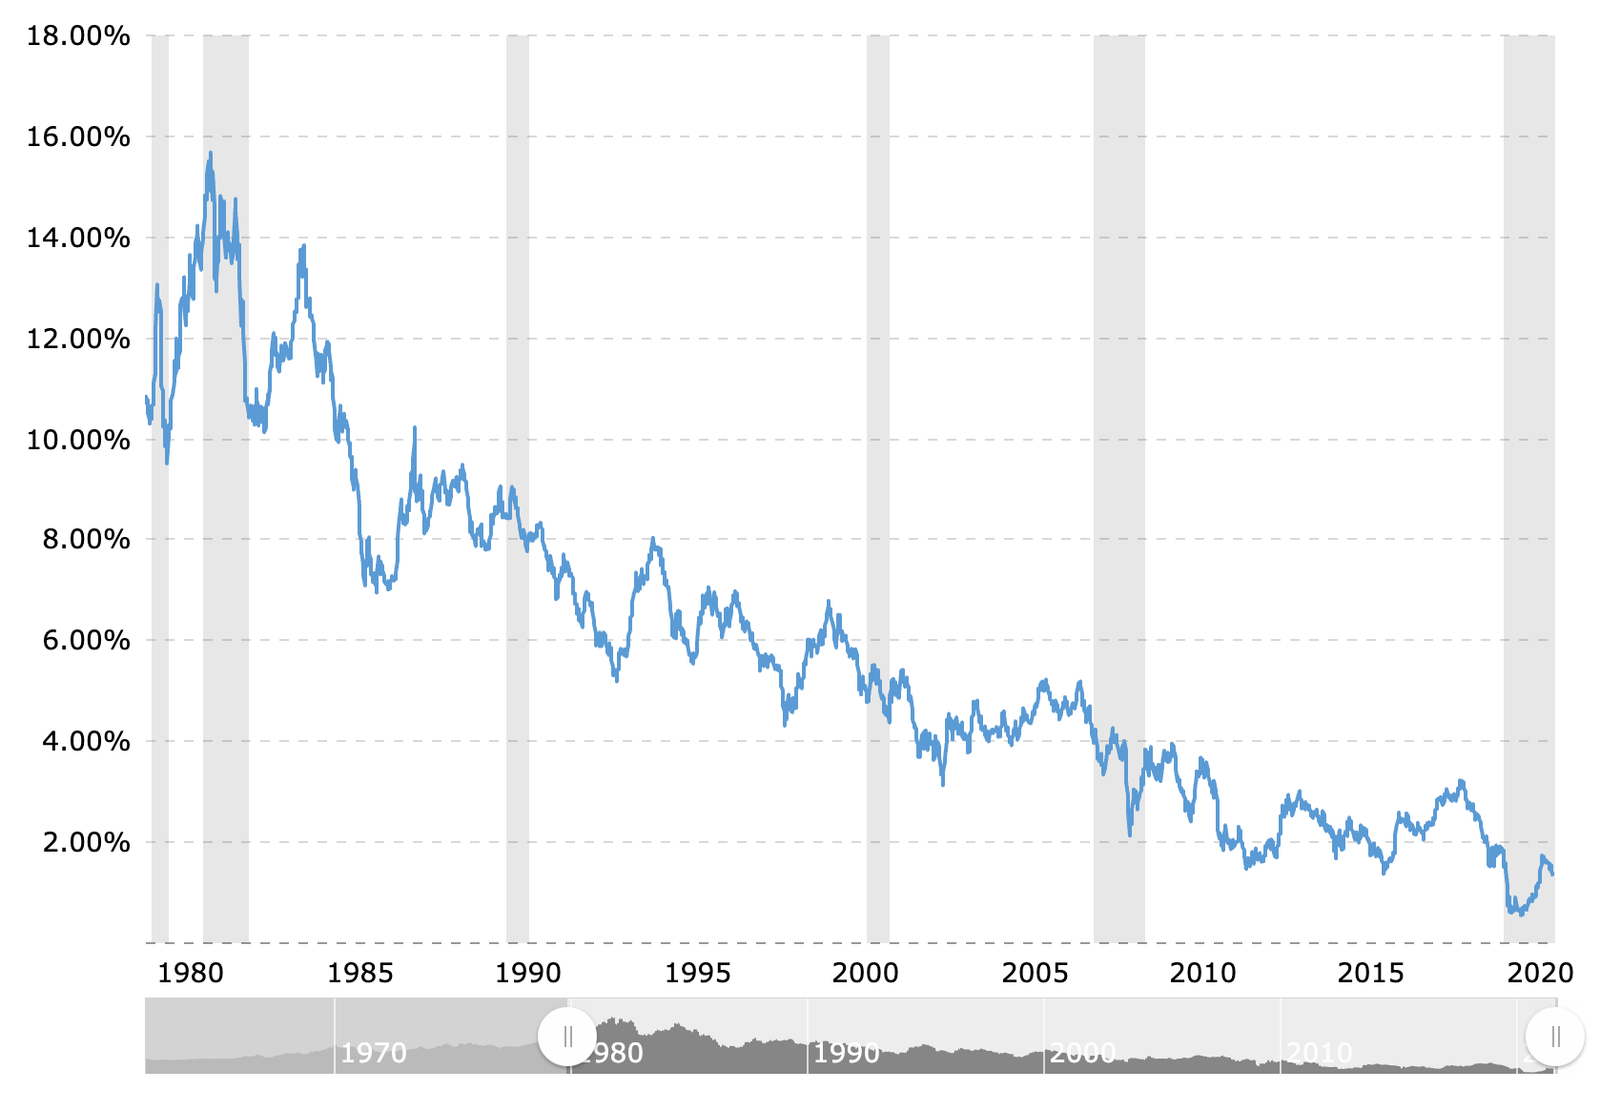
Since 1980, we see an 85% decline in bond yields, which would push the price of a 10 year $50 coupon $1000 bond (5% is approximately the average of the bond yield over the last 40 years) – from $590 to $1340.
This shows that bond prices have more than doubled for similar coupon, or indicating a 2% growth in bond prices over the last 40 years.
The Result:
Putting it together, we have a total inflation for a 50-50 portfolio to measure at (0.5 * 5%) +( 0.5 * 2% ) = 3.5%
Security Savings and Valuables
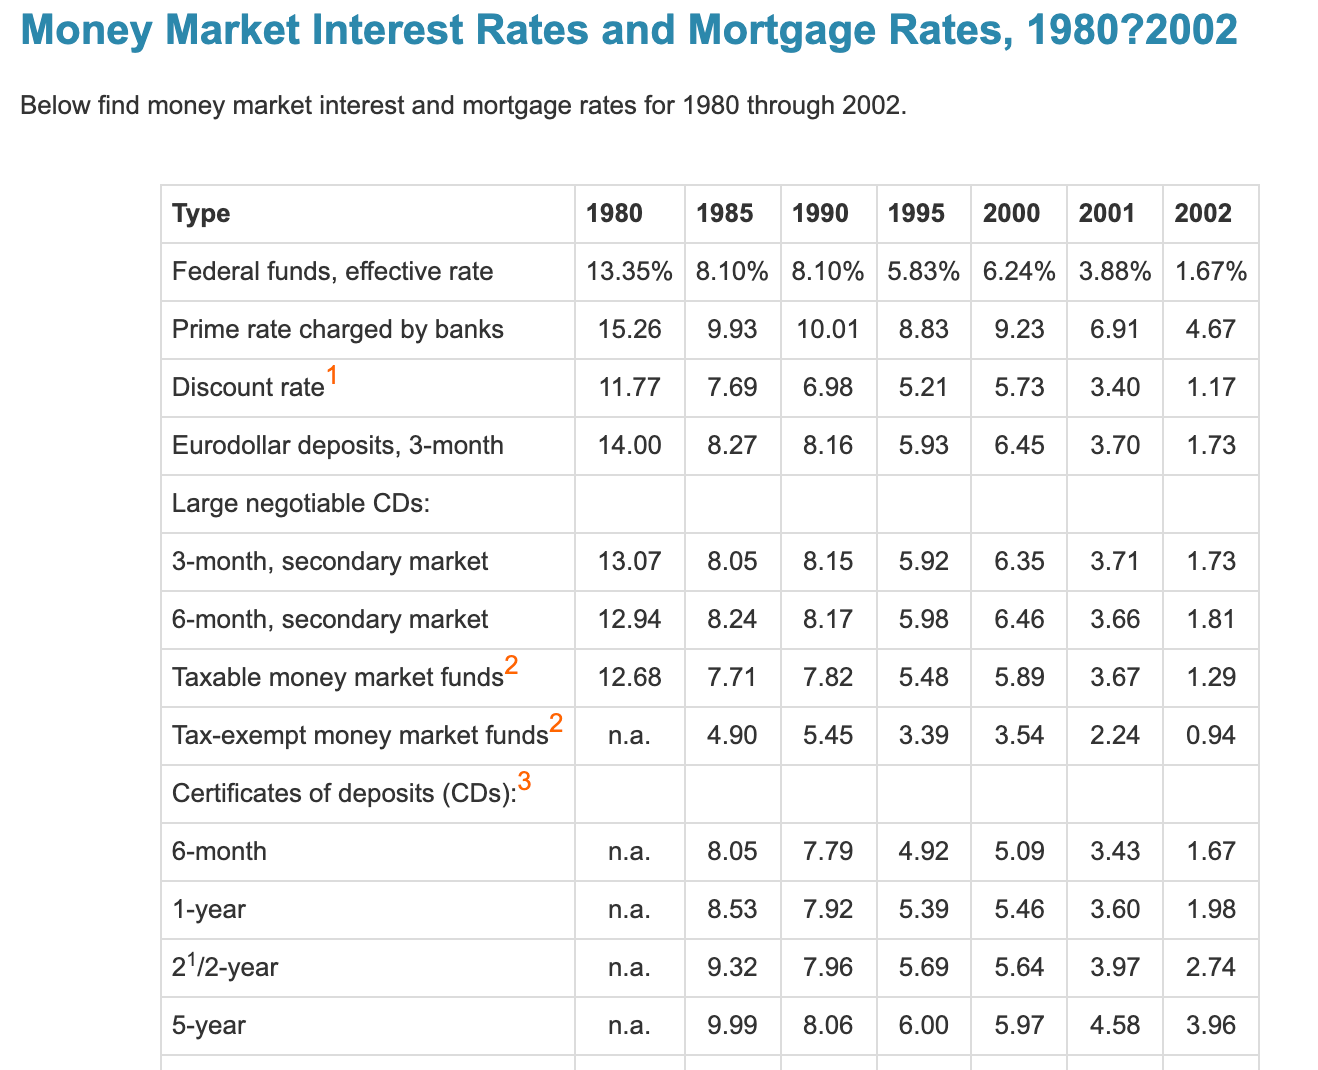
We need money in savings accounts for a rainy day, but savings/ money market accounts behave similar to bonds described above but for reference the MMAs dropped yield from over 12% to under 0.1%.

If not MMAs long term, perhaps we look at what many consider the “ultimate safe haven” aka gold. The Result:
Gold price increased from 555 to 1800. Price increased 2.2 times or at an average growth rate of 2.9% per year.
Putting It All Together Whats my score?
So what does this all mean? Well the first observation is that everything has gotten more expensive and that my dollar seems to be buying me less of everything that I want.
I realize this is intuitive, because we all “feel” it. But let’s put a few calculations together to try to accurately measure our feeling.
We’re not spending 100% of our dollars on corn, or on our houses, or on stocks or bonds so lets allocate the spend in each category to measure overall inflation. If we keep it simple, and evenly break down spend into each of the 4 – that is, we spend 25% of our dollars on things we need, 25% on a place to stay, 25% on making more dollars, and 25% on a safe haven of wealth – we see: (I realize there is lots of variability in this breakdown for each person.)
Total Annual Inflation = (0.25* 2.9%) + (0.25* 4.1%) + (0.25* 3.5%) + (0.25* 2.9%) = 3.35%
Cumulative dollar weakening felt by someone born in 1981 is about 74.5%. Aka $1000 in 1980 are worth $255 today after adjusting for the compounding effect of the inflation each year.
Wages since 1980 What's my score? (part 2)
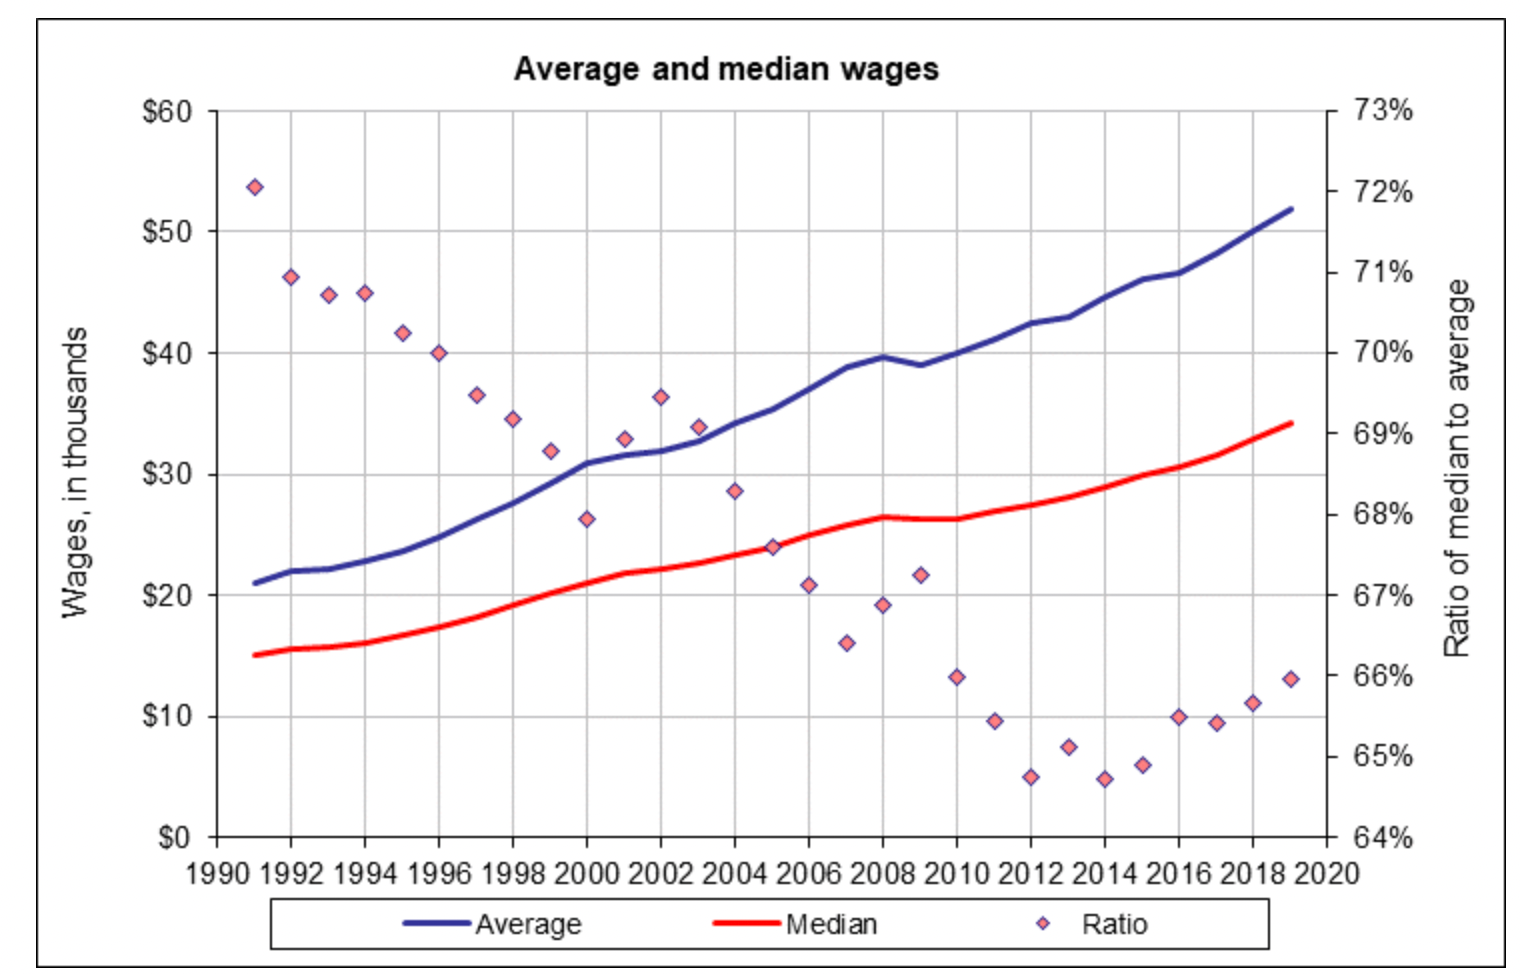
The Result:
For reference, looking at the 30 year average of wage growth in the United States. Wages have grown by about 3%, slightly under our “true” measure of inflation.
